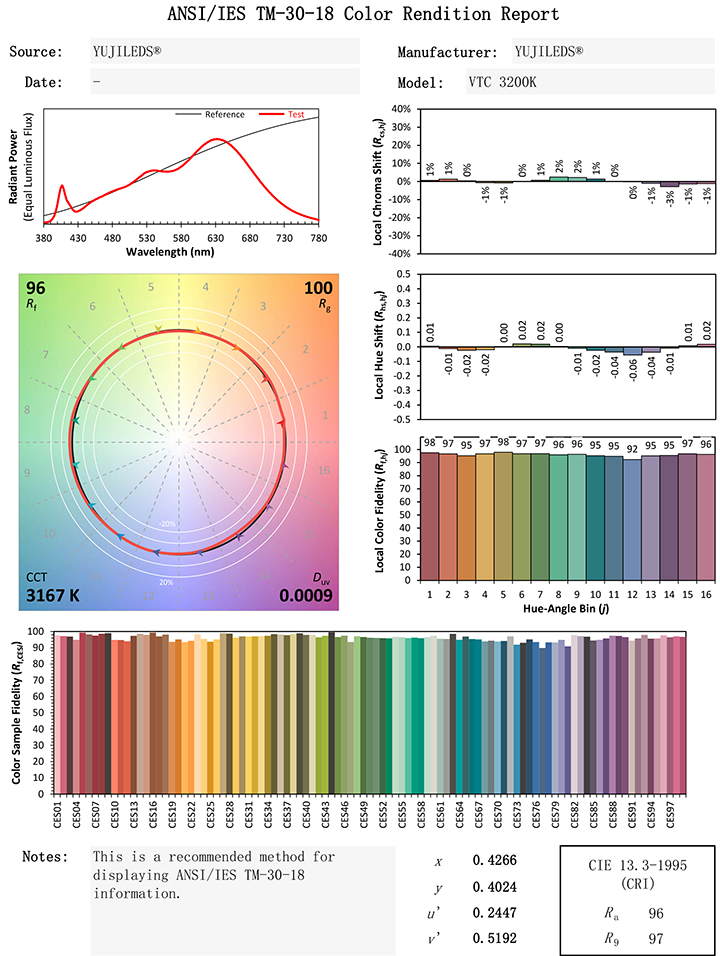
TM-30-18 Tested LED
High fidelity and full color gamut by YUJILEDS.

TM-30 metric is first mentioned in 2015 as TM-30-15, which is defined by Illuminating Engineering Society (IES), providing quantified measurements on overall average properties and describing a method for evaluating light source color rendition. TM-30-18 is the latest released version.
As a new metric which offers comprehensive evaluation on color quality of new light sources especially for the Solid-state Lighting (SSL), TM-30-18 is widely accepted by the lighting markets.
Comparing to Color Rendering Index (CRI) defined by CIE 13.3, TM-30-18 brings different concepts, and multidimensional metrics are mentioned in the new method.
YUJILEDS provides the TM-30-18 tested products and data for evaluating its high color quality LED.
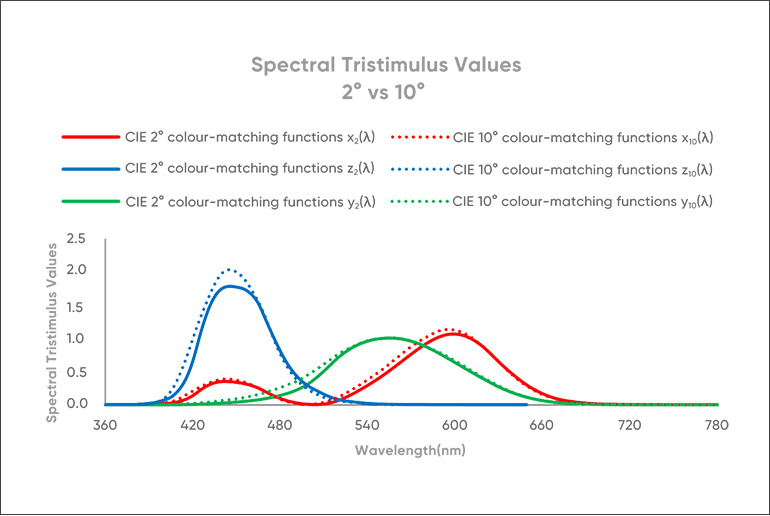

TM-30-18 is based on 10° standard colorimetric of CIE 1964 (CIE 015 introduces the concept of CIE 1964 standard color metric observer). Even though CIE 1931 is still recognized as the most widely used standard, it has to be acknowledged that the 10° observer is much closer to real circumstance in daily life.
The difference of tristimulus values with 2° and 10° is not obvious but should be noticed especially in the range of 400nm-500nm where the 10° observer spectral tristimulus values are relatively higher, which means the human eyes are more sensitive and could distinguish more colors than 2° observer.
TM-30-18 method compares the test sources to different reference illuminants which will be chosen depending on calculated CCTs for the purpose of precise evaluation.

Planckian radiation will be the reference illuminant.

The combination of Planckian radiation and the CIE Daylight illuminant will be the reference illuminant.

The CIE Daylight illuminant will be the reference illuminant.
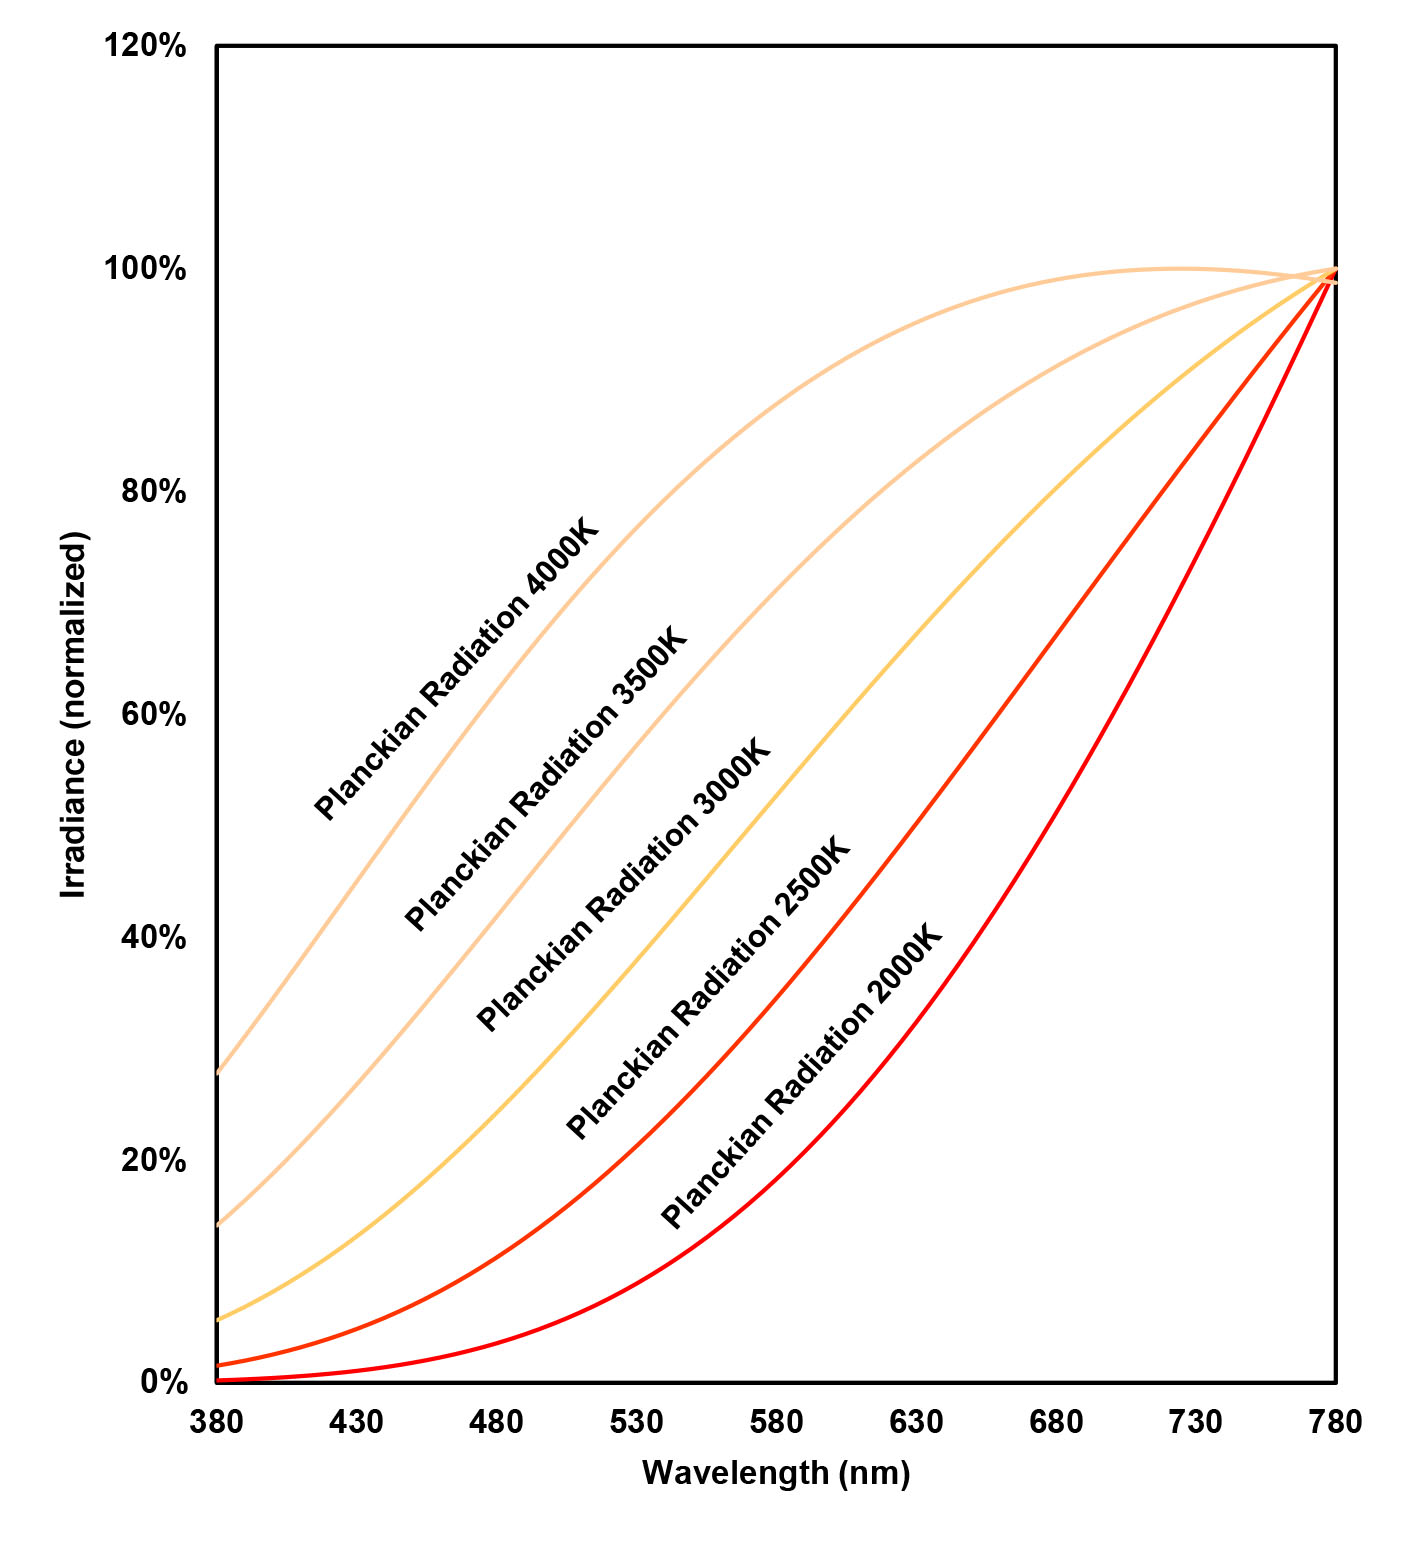
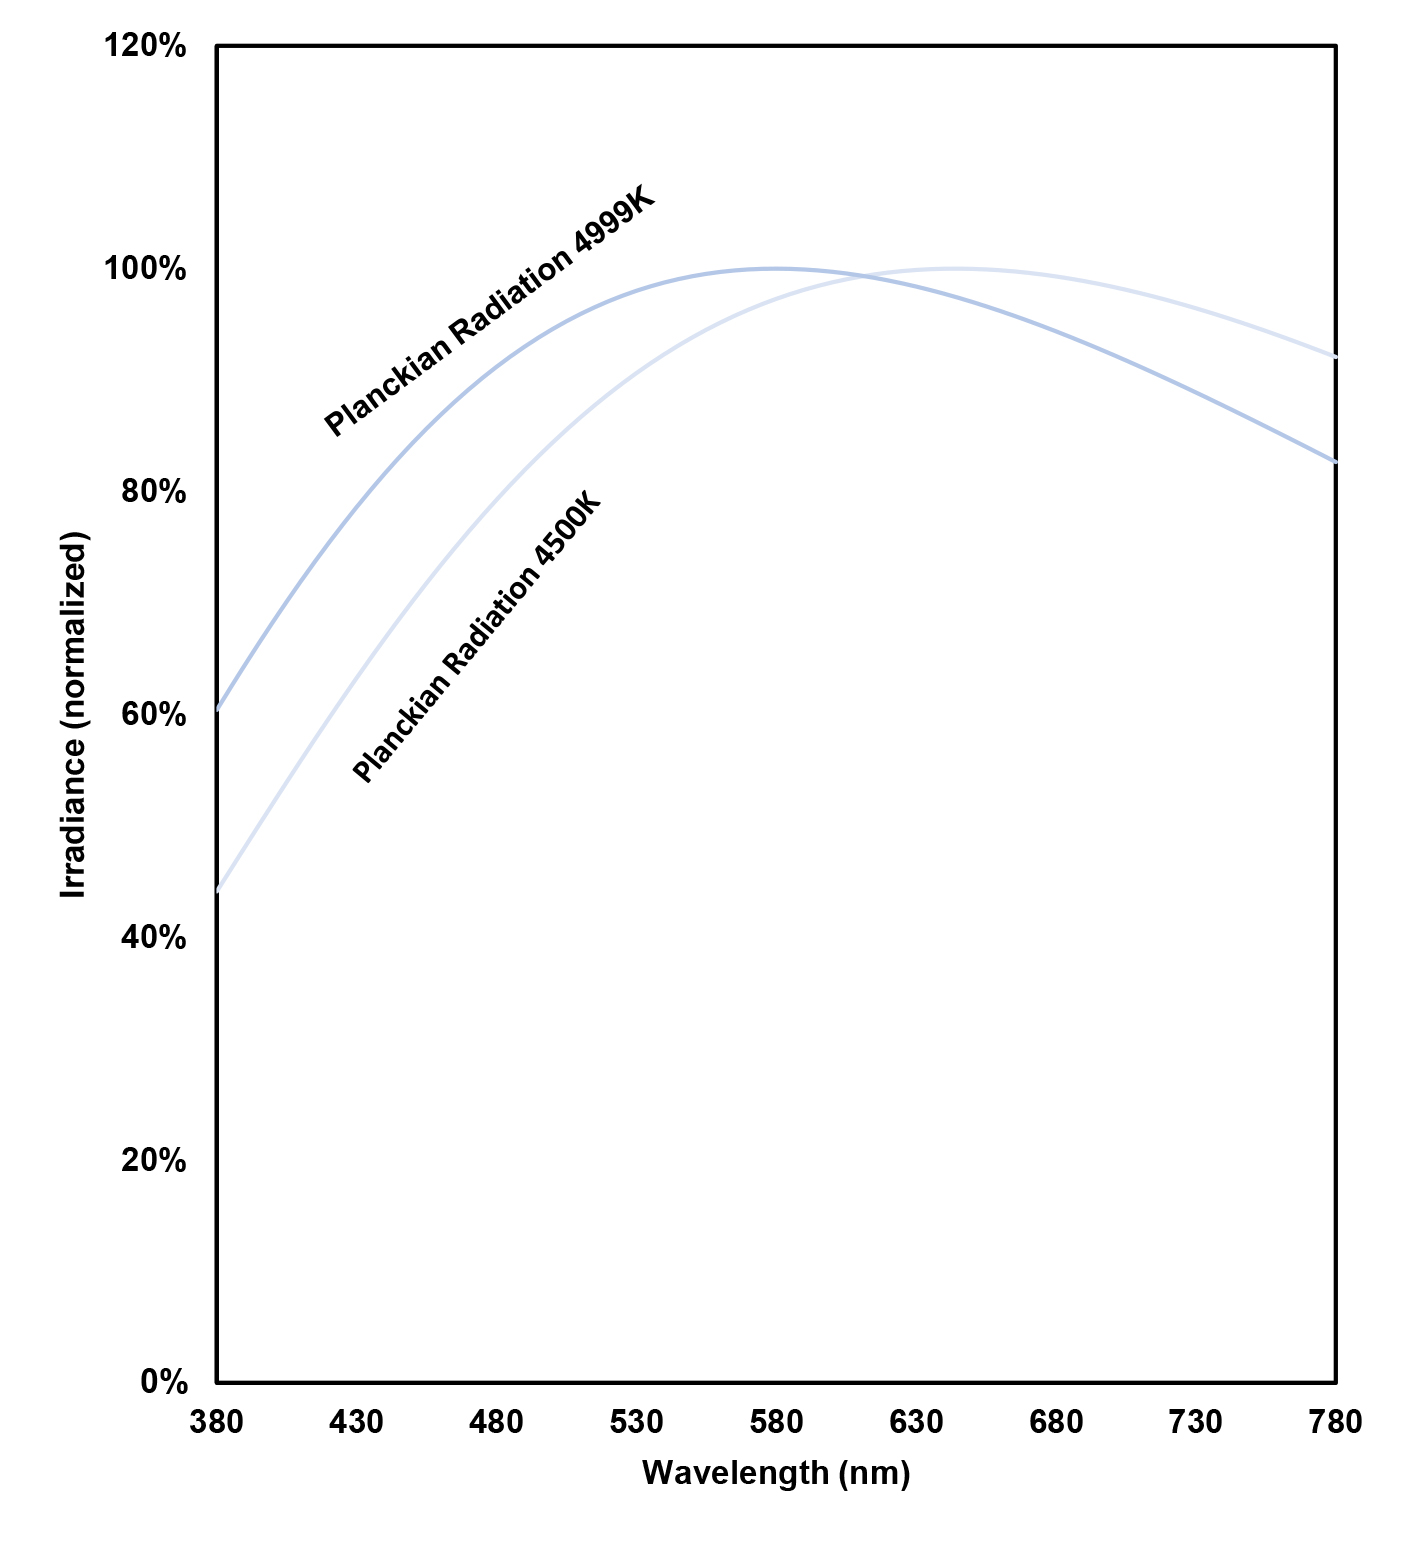
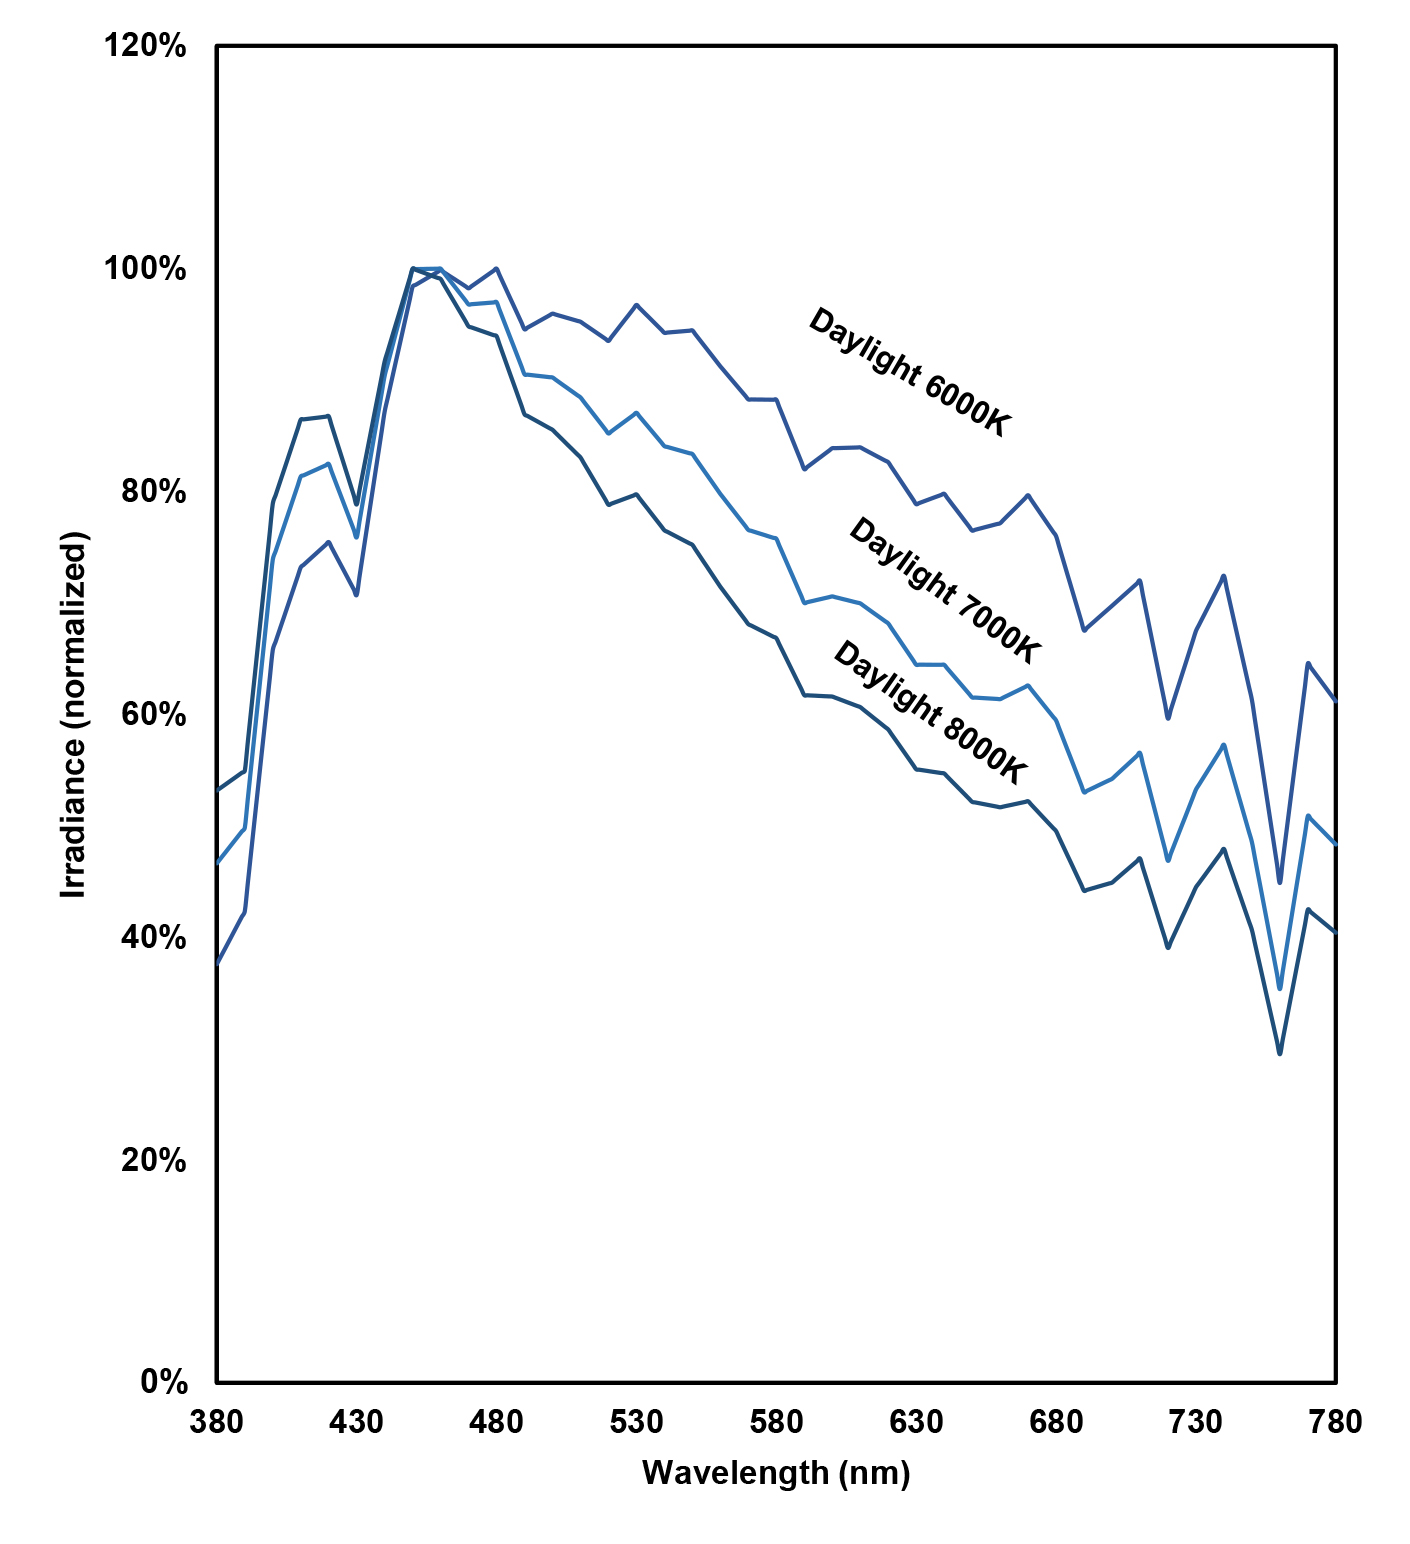
Planckian radiation will be the reference illuminant.
The combination of Planckian radiation and the CIE Daylight illuminant will be the reference illuminant.
The CIE Daylight illuminant will be the reference illuminant.
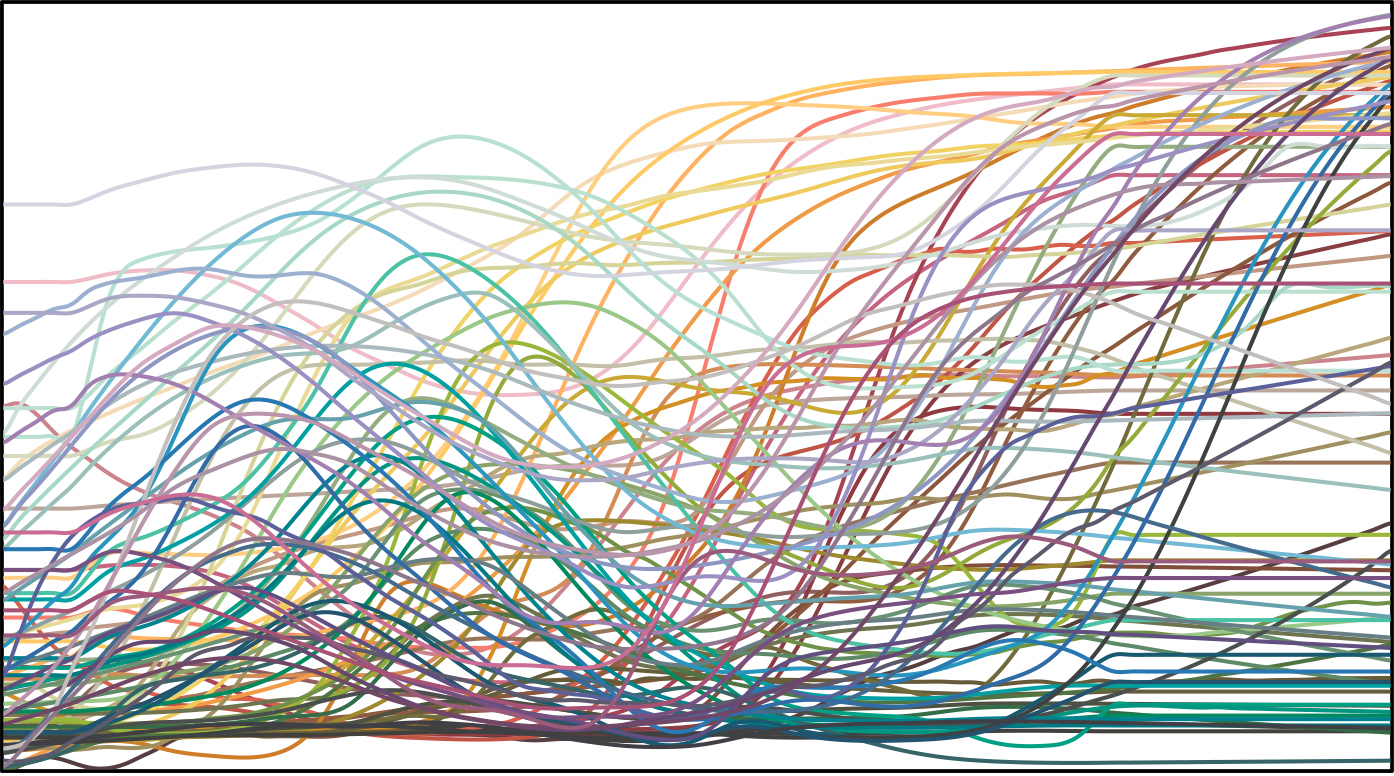
TM-30-18 method utilizes 99 color evaluation samples (CES) which are selected from more than 100,000 measured objects to be representative of the world of possible colors, those of which are based on various origins as textiles, plastics, skin tones and color systems.
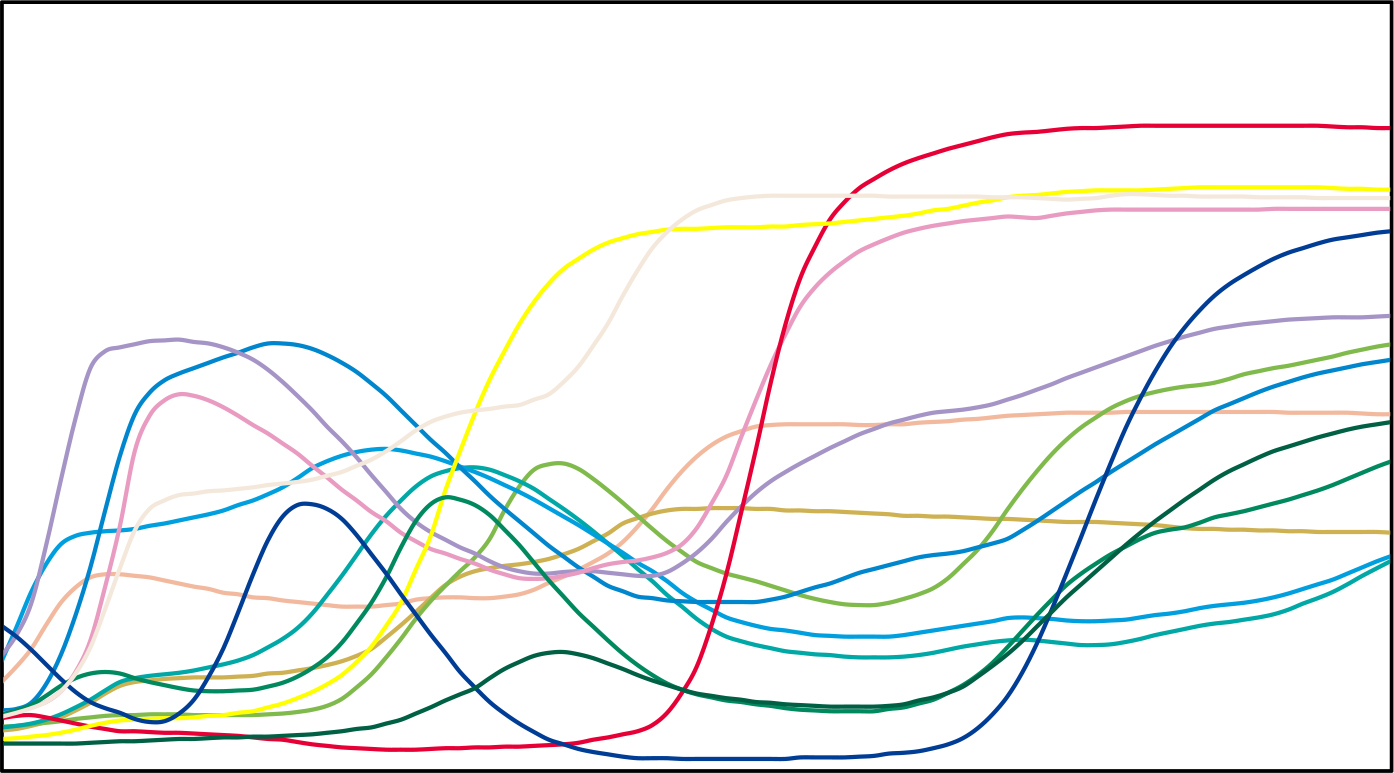
Comparatively, CRI utilizes 15 test color samples (TCS) which do not represent the actual colors in the real world, and the general color rendering index only calculates the arithmetic mean value on the first 8 TCS.
The fidelity index Rf has been introduced to the Technical Report CIE 015:2018 and it is aiming to be a new standard for color evaluation. Similar as color rendering index, Rf is an accurate measure of average color fidelity and has a range of 0 to 100, with higher numbers indicating more similarity to the reference.
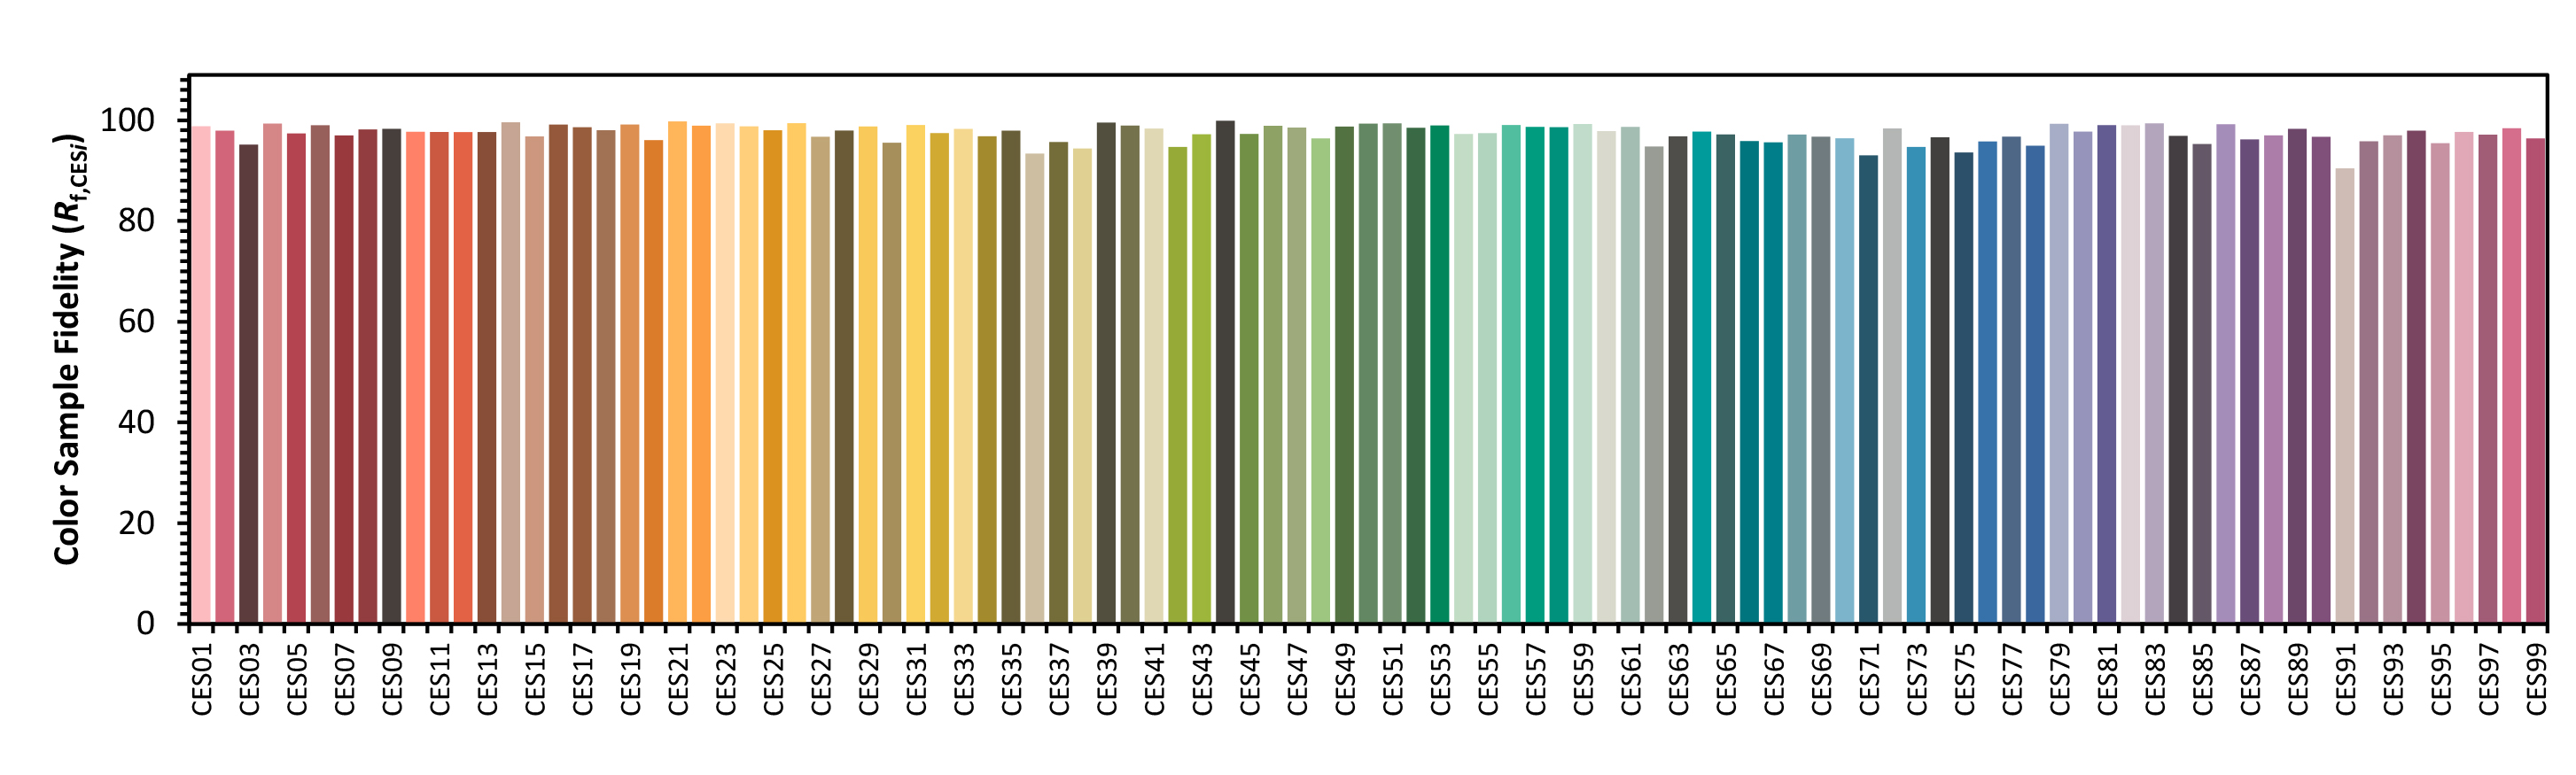
The fidelity index Rf is the average and calculated by determining the arithmetic mean of color difference ∆E. TM-30-18 defines 99 color evaluation samples and each sample has different spectral reflectance to the reference illuminant, thus we will get 99 different color fidelity values Rf,CESi, while individual Rf,CESi values may be imperfect at predicting the fidelity of similar color, due to metamerism, but it is still helpful to identify light sources with greater disparity in rendition of similar-colored objects when considered collectively.
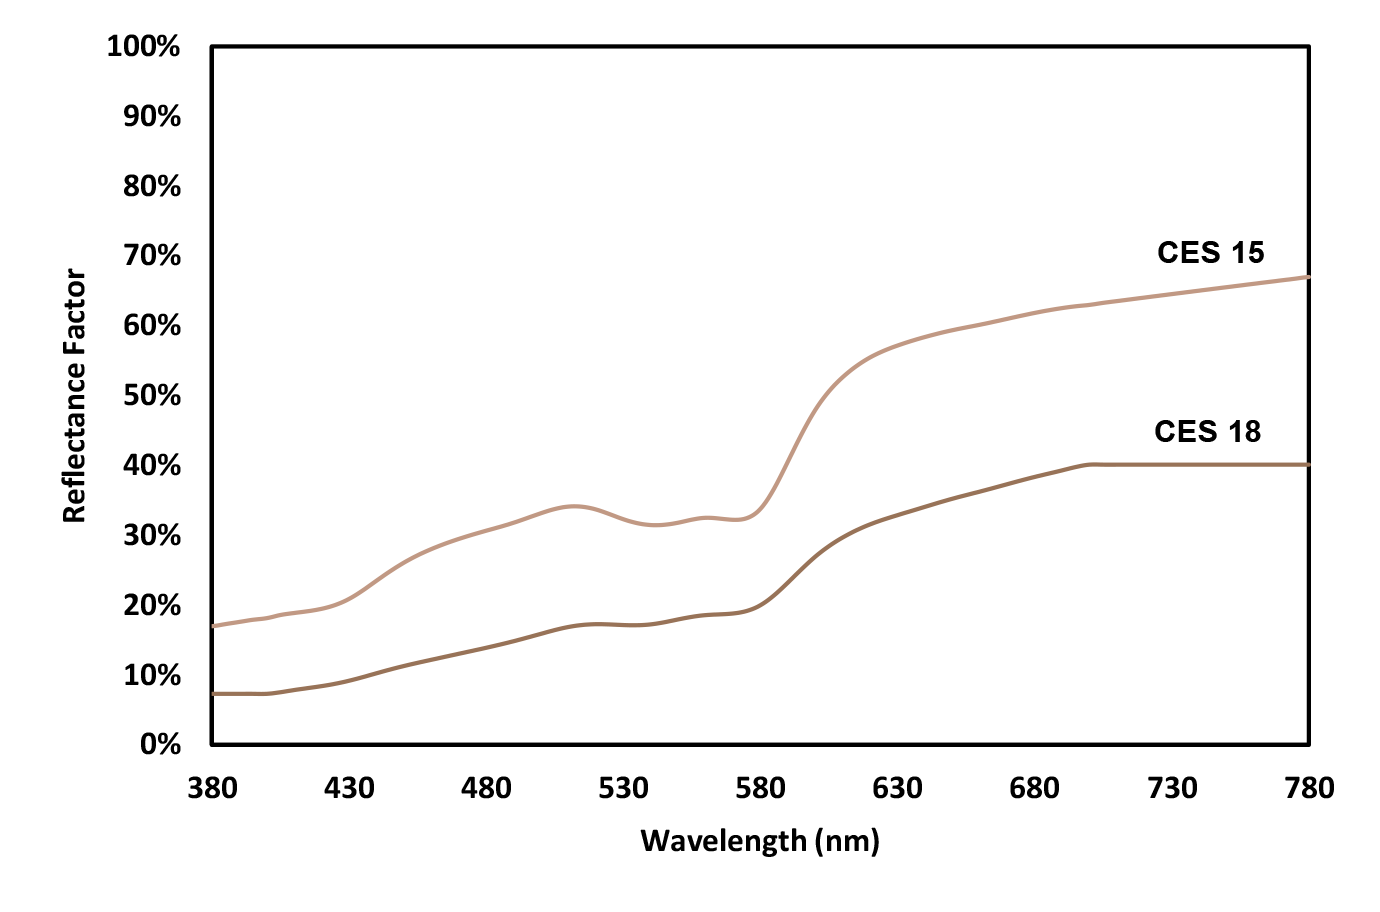
For specific attention, the CES 15 and CES 18 may be most concerned since they represent human skin tones. Comparing to Ri of Color Rendering Index, the Rf, CESi of TM-30-18 is more comprehensive to evaluate much more colors.
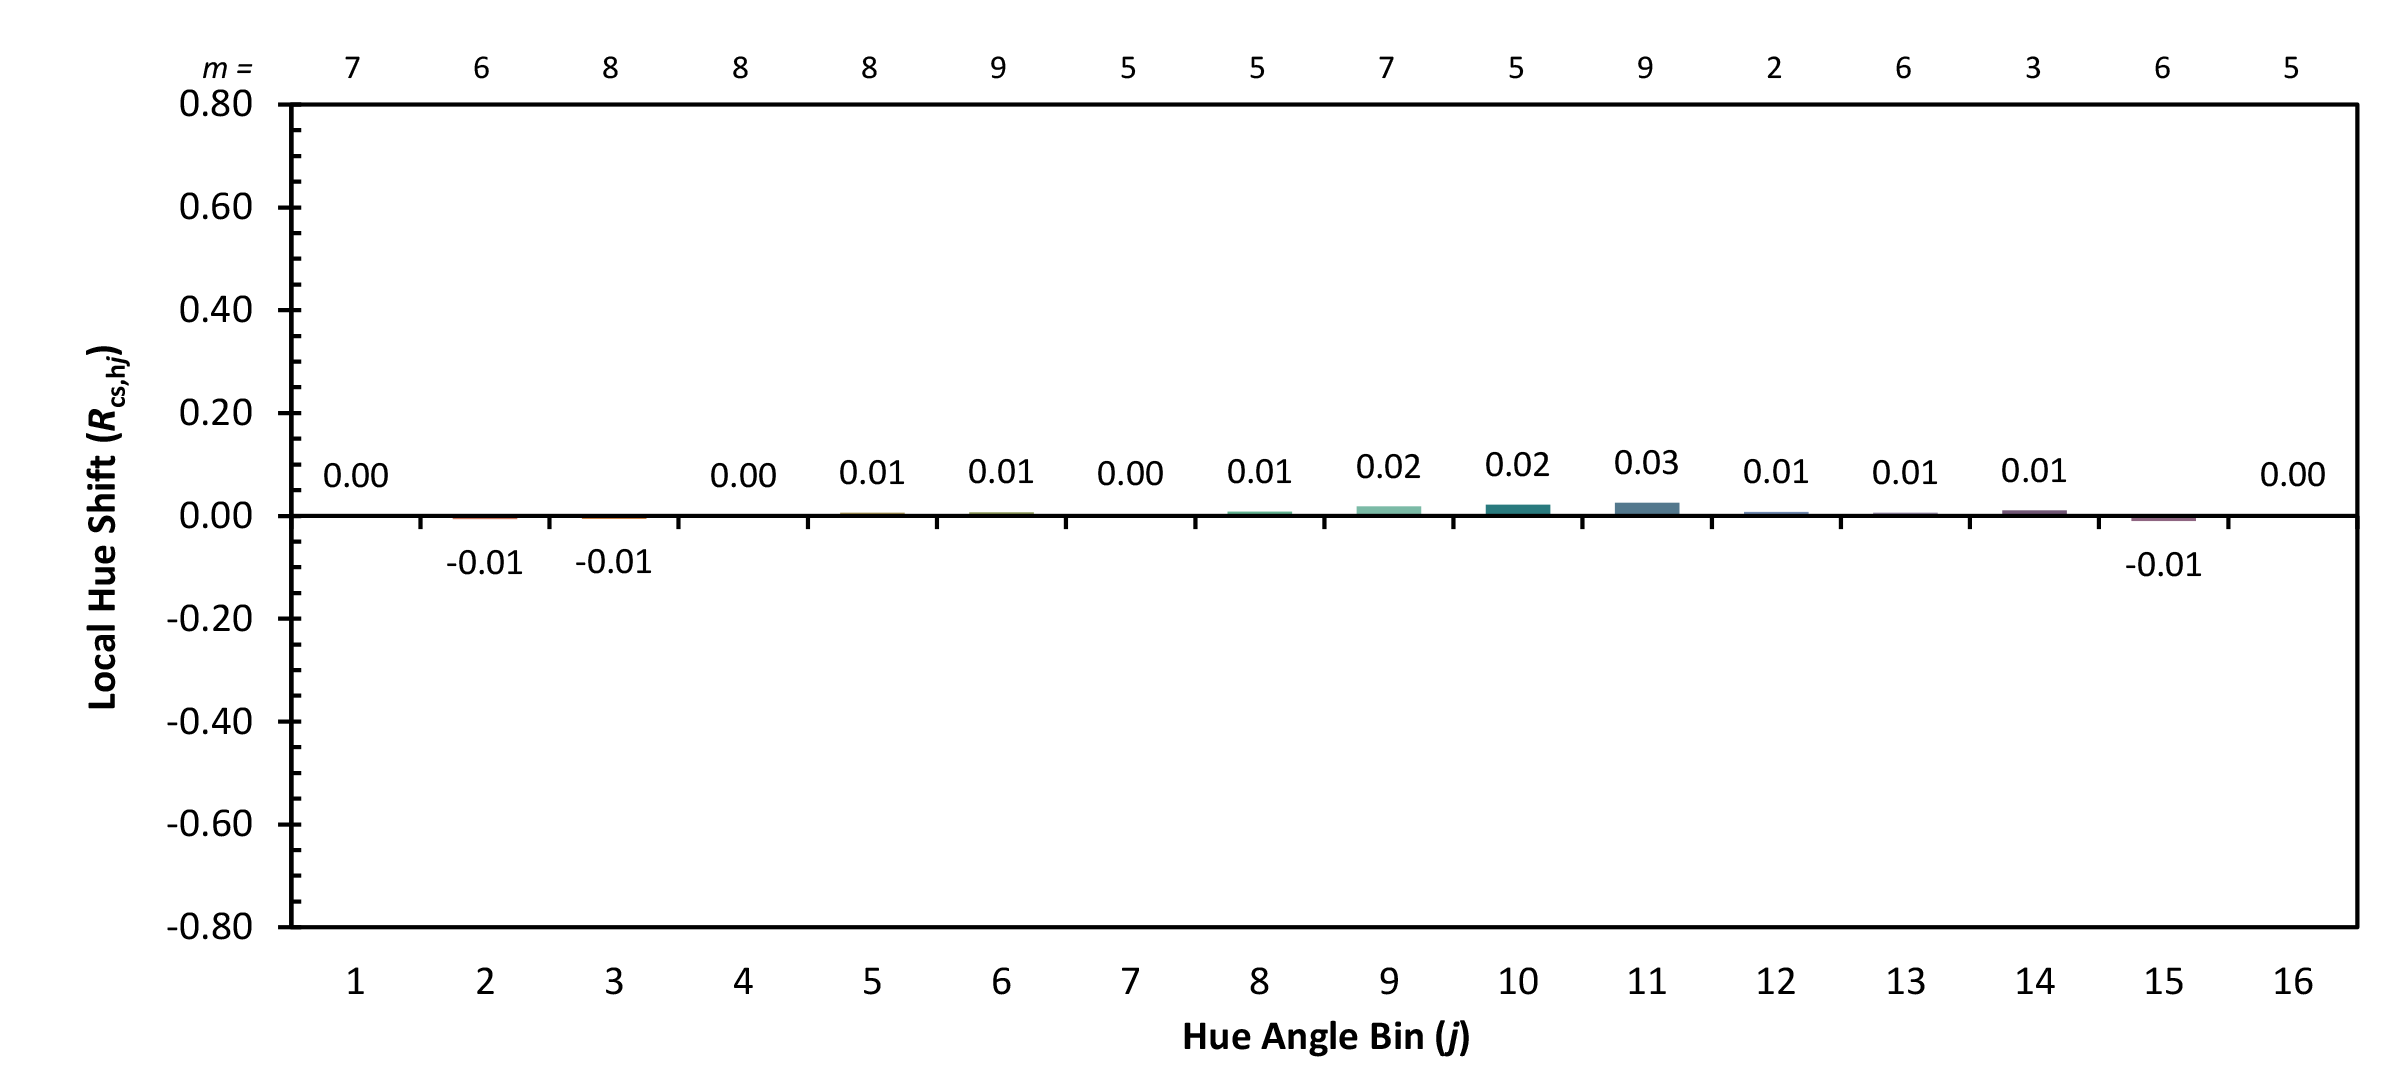
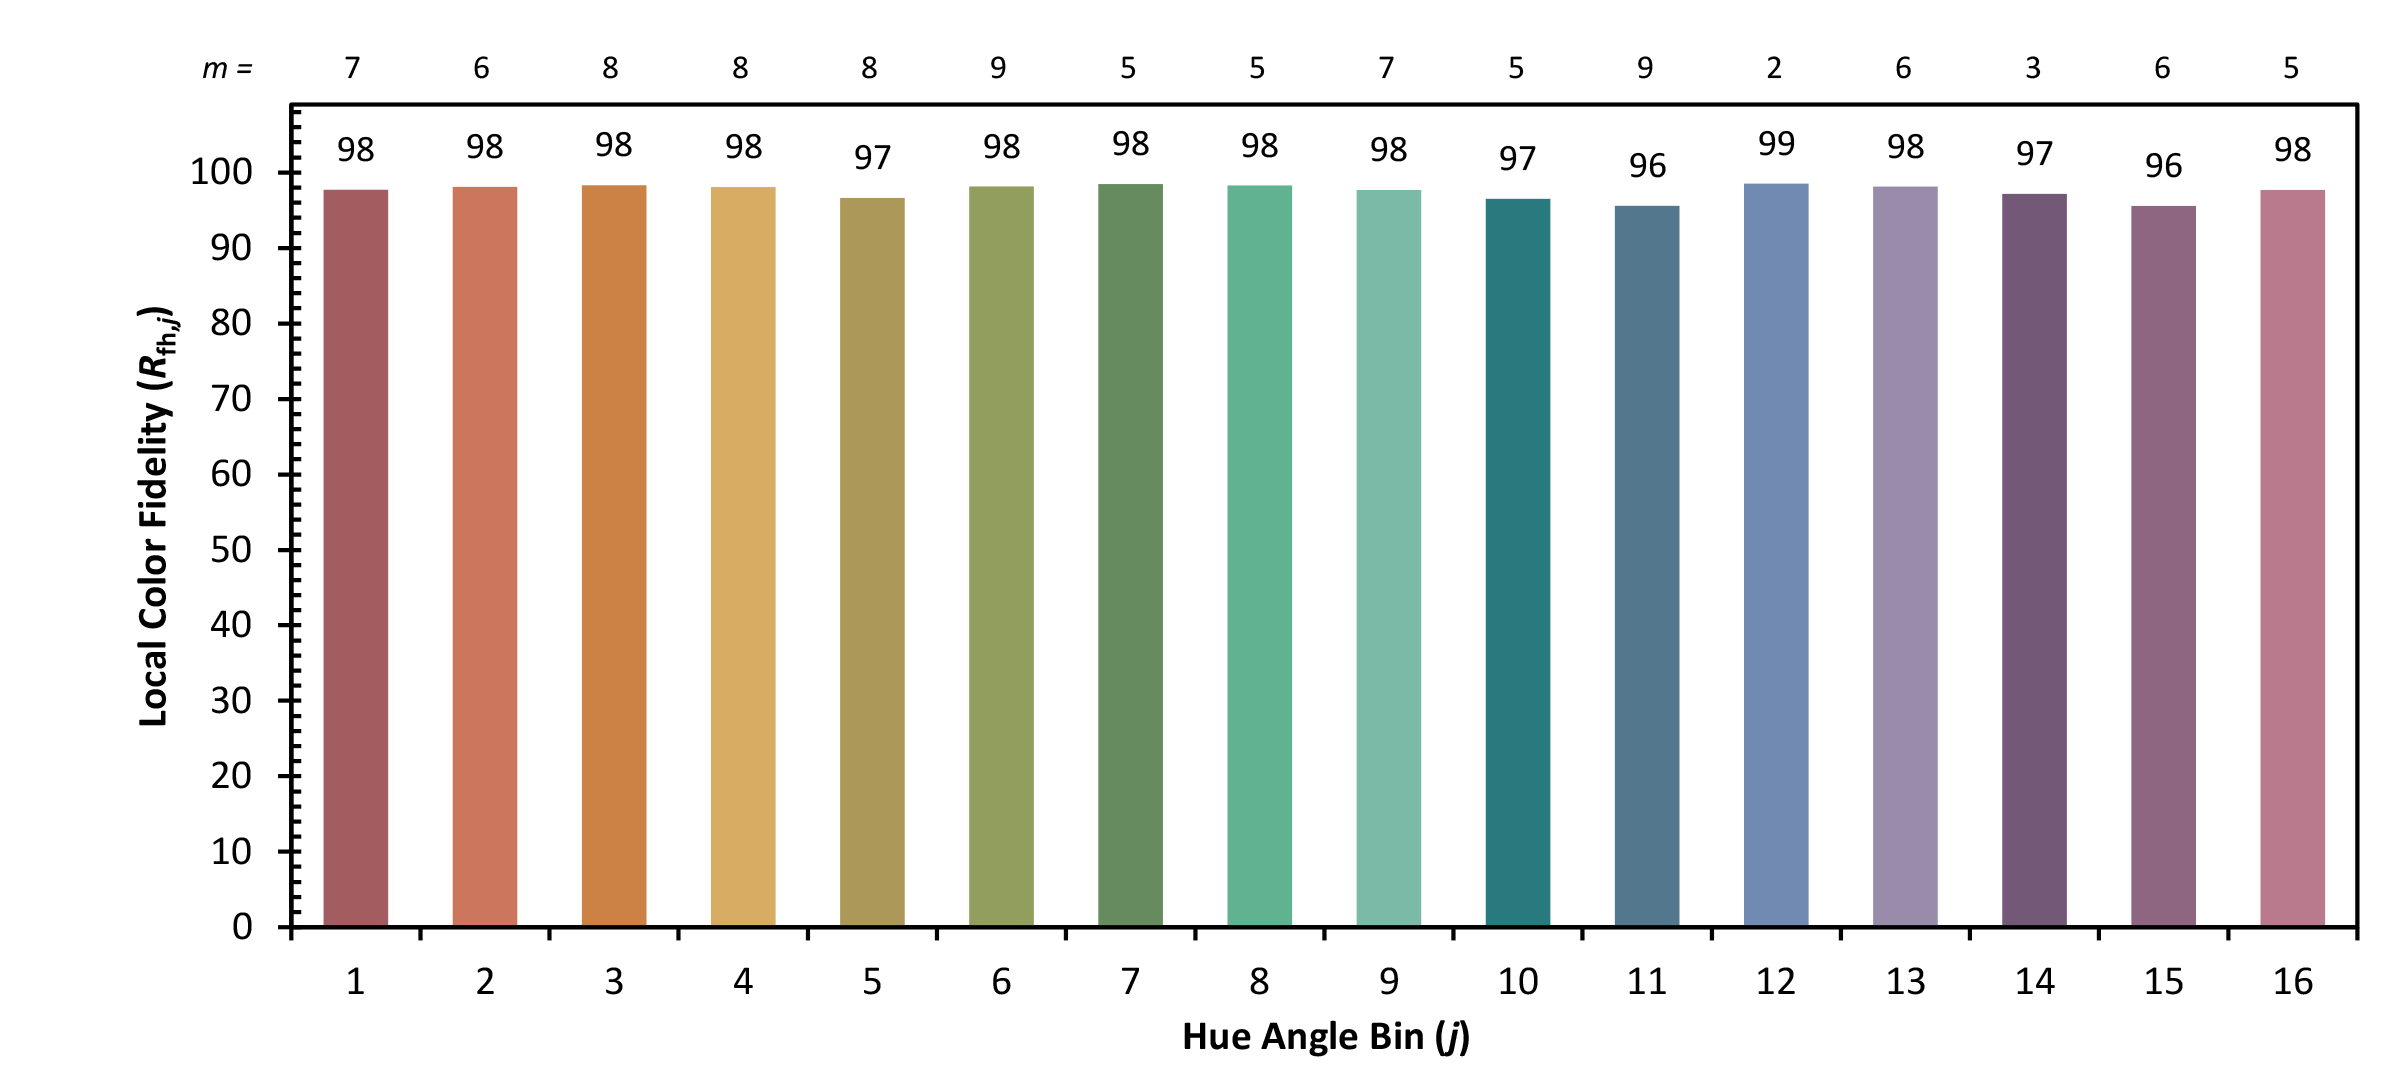
The 99 CES colors are divided in 16 groups in CAM02-UCS, and 3 metrics are introduced from the 16 groups.
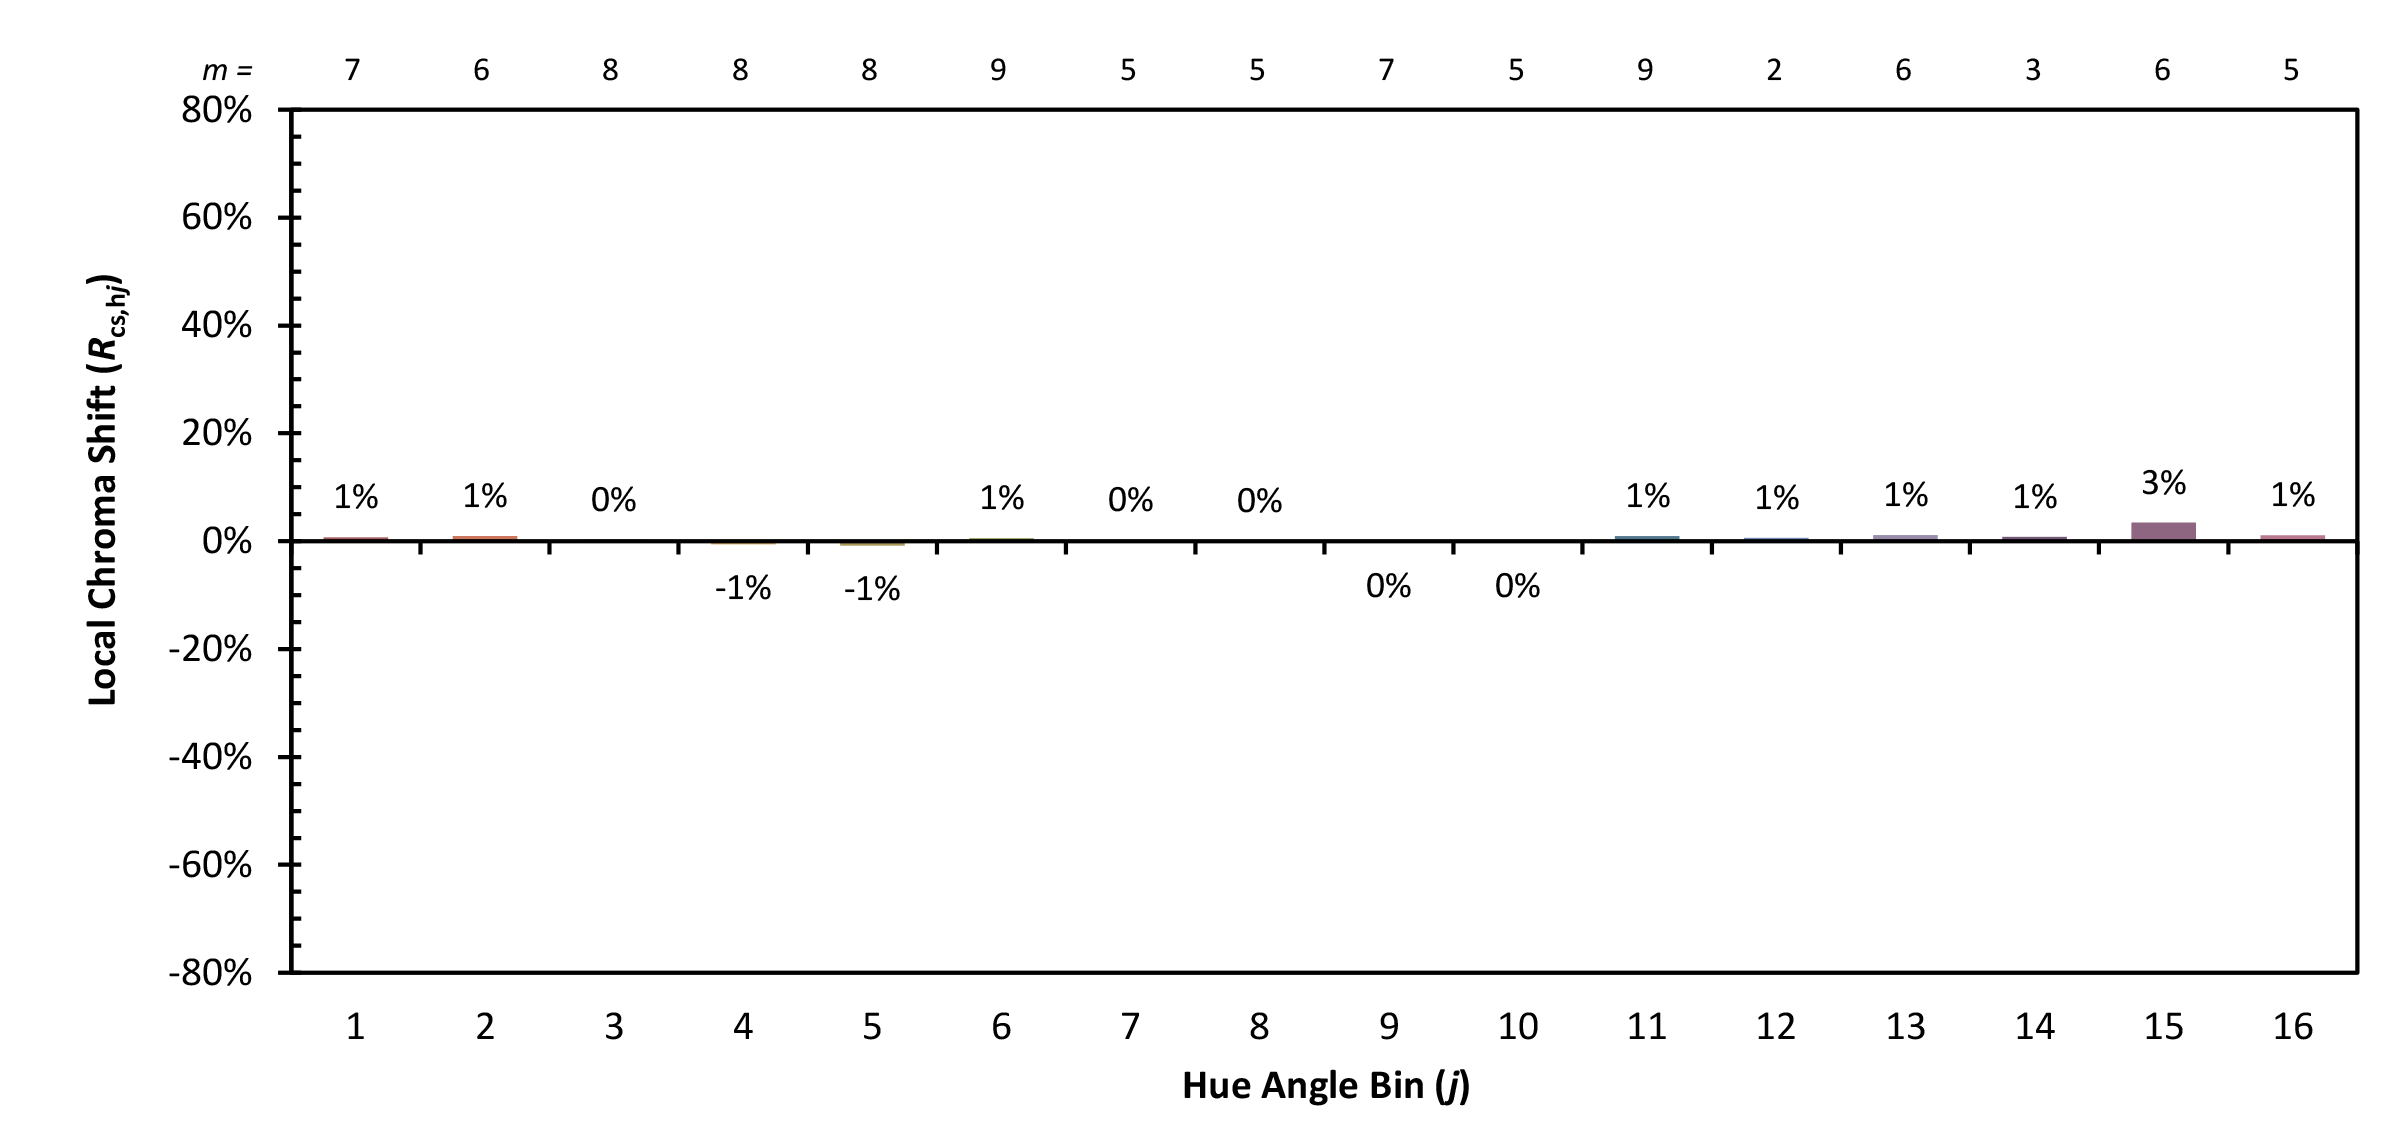
Represent a relative average chroma shift as percentage, negative value indicates a decrease in chroma, and positive value indicates an increase in chroma, j = 1 ~ 16.
Represent the hue shift within a hue-angle bin, negative value indicates a clockwise shift, and positive value indicates a counterclockwise shift, j = 1 ~ 16.
Same calculation procedure as Rf and range as 0 – 100. Rf, hj is analogous to the special color rendering indices of the CIE Test Color Method, j = 1 ~ 16.
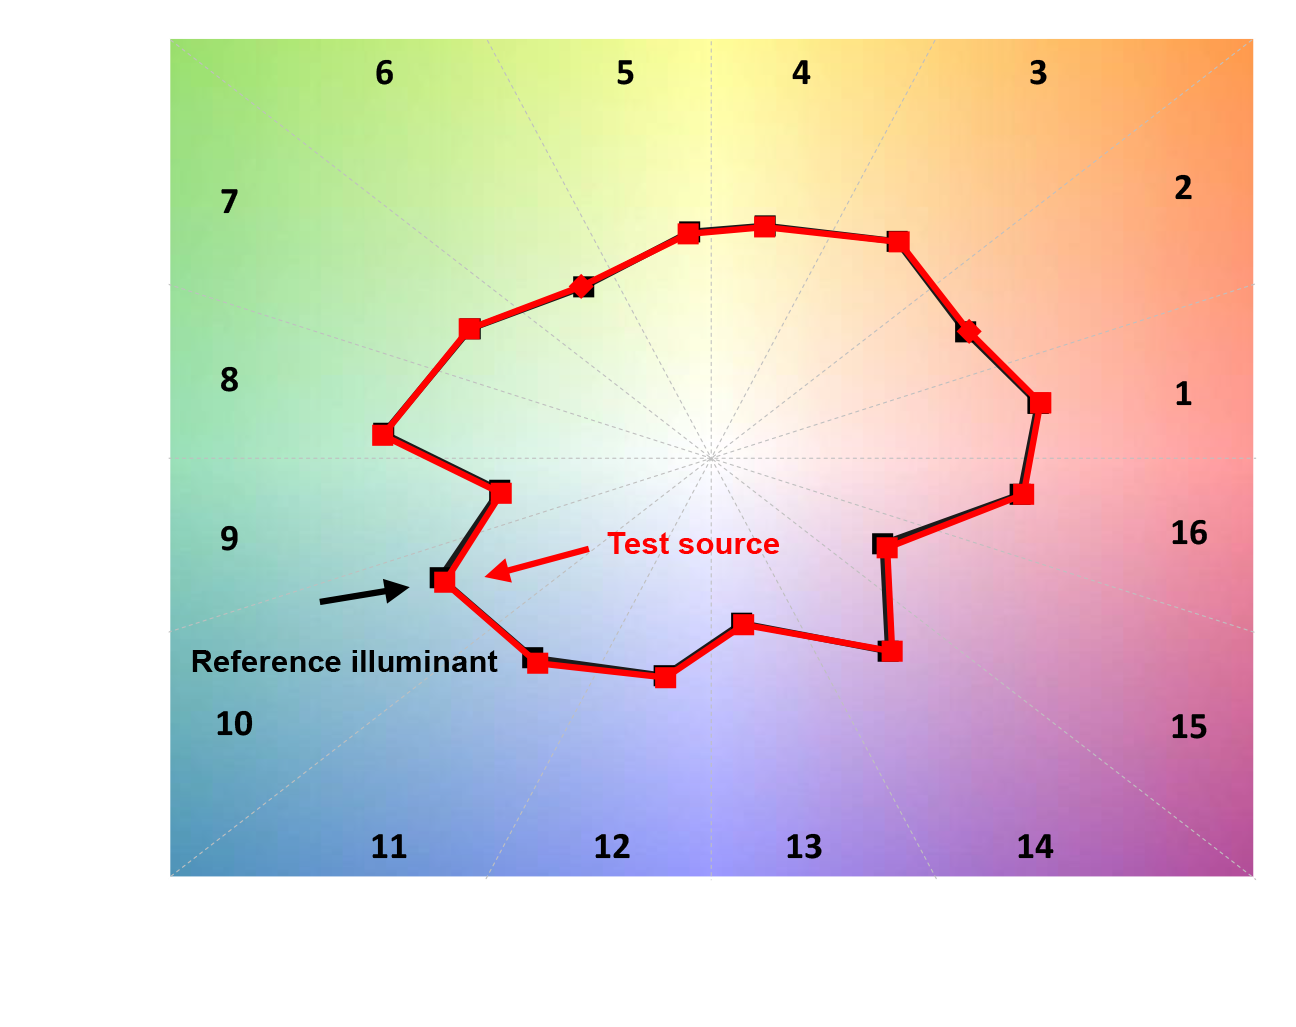
In addition to an improved color fidelity metric, the TM-30-18 method introduces an additional dimension to color quality through the gamut index (Rg). The Rg gamut index provides information about the relative range of colors that can be produced (via reflection) by a white light source. A score close to 100 indicates that, on average, the light source reproduces colors with similar levels of saturation as an incandescent bulb (2700K) or daylight (5600K/6500K). For LEDs of decent color quality, Rg can typically range between 80 and 120, with higher scores representing higher overall levels of saturation.


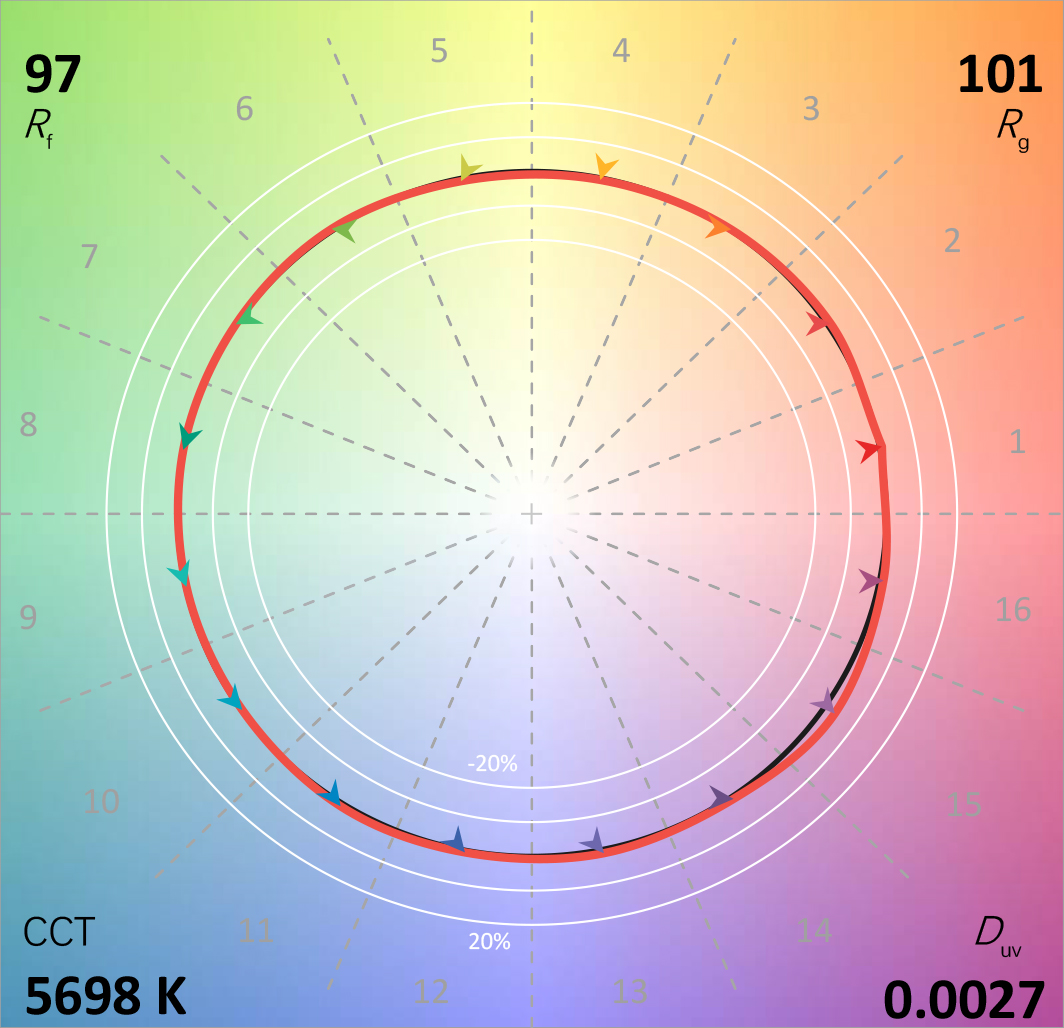
The color vector graphics are very intuitive and informative tools in informing us about a color source’s tendencies to reveal certain colors as appearing more vivid while others dull. For applications such as task lighting where color accuracy is required, a smooth, evenly distributed vector chart would be desired. On the other hand, for certain applications such as retail, over-saturation in certain colors may even be preferred in order to increase its vividness. YUJILEDS provides wide ranges of phosphors that allow for manufacture of LEDs with customized SPDs that can increase saturation in particular color.
The pure radical shift in the vectors is quantified in a series of 16 measures referred to as local chroma shift, with each value corresponding to one of the hue-angle bins.